
A technical blog explaining why TOPCon outperforms PERC in most environmental indicators, why silver remains the key trade-off
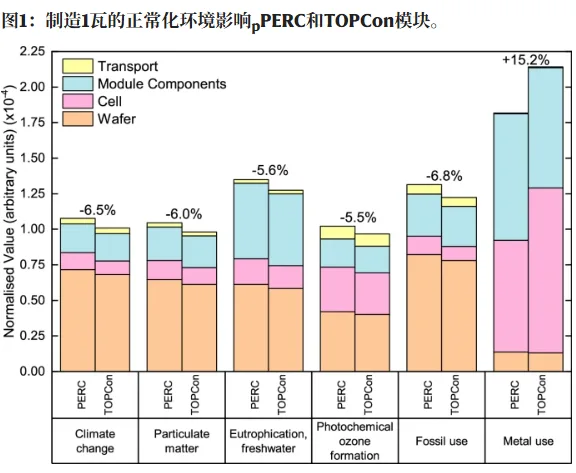
Quick answer: A life-cycle assessment comparing TOPCon against PERC finds TOPCon better on almost every environmental measure except silver. The two architectures use broadly the same process chain, so the difference concentrates in what is added at the rear and what it costs in materials. TOPCon's advantage comes from higher efficiency per wafer, which spreads the upstream impact of polysilicon and wafering across more watts. The exception is silver: the metallisation paste carries a lifecycle impact share well above its mass — figures in the study put the contribution of a small mass fraction at 9.6% and comparable levels, while the process-level reductions elsewhere reach 26%, 41% and 78%. Forecasts to the mid-2030s expect silver intensity to fall by around 10% a year under ITRPV projections. The trade-off is narrow but real, and it is the reason silver reduction is now a headline topic.
PV Module Manufacturing · by Jerry, Ooitech
Product Introduction
TOPCon Beats PERC Almost Everywhere, Except Silver
At a recent production line upgrade meeting, one question came up again and again: if a PERC line is converted to TOPCon, does the carbon account really make sense?
A recent life cycle assessment gives a clear quantitative answer. According to Maximising environmental savings from silicon photovoltaics manufacturing to 2035, published in Nature Communications 17, 2311 (2026), DOI: 10.1038/s41467-026-69165-x, TOPCon performs better than PERC in 15 out of 16 environmental impact categories. The carbon footprint drops by about 6.5% per Wp, but the cost is a 15.2% increase in metal resource use, mainly due to higher silver consumption from double-sided silver paste.
In simple production language: TOPCon is cleaner than PERC in most indicators, but silver is the one place where it still loses.
The normalized bar chart in Figure 1 makes the message very direct. Silver-related metal resource use is the only obvious negative item, while most other environmental indicators improve.
Technical Parameters
Key LCA Numbers from the Baseline Scenario
The baseline scenario in the study is based on modules manufactured in China, transported to Central Europe, using 2023 technology assumptions. Several numbers are especially important for manufacturers and investors evaluating TOPCon upgrades.
| Indicator | TOPCon Result / Finding | Comparison or Meaning |
|---|---|---|
| Climate change impact | 0.40 kg CO₂-eq/Wp for European manufacturing, 0.73 for China average, 0.95 for India | TOPCon is about 6.5% lower than PERC under the same boundary conditions |
| Metal resource use | TOPCon is 15.2% higher | Mainly caused by double-sided silver paste; PERC rear side uses Ag + Al |
| Other 14 environmental categories | Generally reduced by 2–10% | Includes freshwater eutrophication, particulate matter, photochemical ozone formation, fossil resource use and others |
| Dominant manufacturing stage | Wafer stage dominates 12 out of 16 indicators | Silicon purification electricity is the largest hotspot |
| Wafer electricity contribution | 89.9% of total module climate impact | The carbon intensity of electricity used in polysilicon and wafer production is decisive |
| Metallization contribution | 53% of module-level metal resource impact | Within the cell stage, metallization contributes 98.3% of metal resource impact |
Where the Environmental Cost Really Comes From
Figure 2 splits the TOPCon module into wafer, cell, module and transportation stages. The result is not very friendly to anyone focusing only on cell-line optimization: the biggest environmental hotspot is not the TOPCon cell process itself, but the upstream silicon and wafer stage.
Silicon purification electricity accounts for more than 85% of the wafer-stage impact, and wafer electricity contributes 89.9% of the total module climate impact. In other words, even if passivation is excellent and paste consumption is pushed to the limit, the carbon result can still be poor if the polysilicon and wafer are produced with coal-heavy electricity.
The only real troublemaker inside the cell stage is silver. Metallization contributes 53% of the metal resource indicator at full module level, and 98.3% inside the cell stage. This strongly supports the direction of copper plating, busbar reduction, multi-busbar optimization and silver reduction technologies.
Technical Advantages
What TOPCon Actually Improves
From an LCA perspective, TOPCon’s advantage is not just a marketing story about higher efficiency. The higher conversion efficiency reduces material use per watt and improves most environmental indicators when the system boundary is calculated per Wp.
The Silver Problem Cannot Be Ignored
TOPCon’s double-sided silver metallization gives it a measurable penalty in metal resource use. This does not overturn the overall LCA advantage, but it changes the priority list for production engineers.
For TOPCon, silver reduction is not only a cost issue. It is also an environmental bottleneck. If the industry wants TOPCon to keep its environmental lead while scaling massively, reducing silver grams per watt is no longer optional.
Product Application
Manufacturing Location and Grid Decarbonization Matter More Than Many People Expect
The study compares India, China, the United States and Europe from 2023 to 2035, considering two major variables: ITRPV technology progress and grid decarbonization under EIA low-zero-carbon cost scenarios.
Several results are worth remembering:
| Scenario | Climate Impact / Saving | Practical Meaning |
|---|---|---|
| 2023 European manufacturing | 0.40 kg CO₂-eq/Wp | Lowest among the compared regions in the study |
| 2023 China average | 0.73 kg CO₂-eq/Wp | Mid-range result, strongly affected by electricity mix |
| 2023 India manufacturing | 0.95 kg CO₂-eq/Wp | Highest among the listed baseline regions |
| Technology progress only by 2035 | Average reduction of about 0.10 kg/Wp | Efficiency improvement, silver reduction and silicon saving help, but are not enough alone |
| Technology plus grid decarbonization | 8.2 Gt manufacturing-side CO₂-eq reduction potential by 2035 | The largest saving comes mainly from cleaner electricity and manufacturing location choices |
The 8.2 Gt saving potential is very large, equal to about 13.9% of global anthropogenic emissions in 2019. More importantly, most of this saving comes from electricity decarbonization, not simply from changing the cell structure.
Sub-Grid Differences Can Be Larger Than Country Labels
A very important conclusion is that “Made in China” alone does not define the carbon footprint. Inside China, if the highest and lowest carbon-intensity sub-grids are compared, TOPCon manufacturing emissions can range from 0.32 to 0.58 kg CO₂-eq/Wp. This spread can be larger than the difference between the China average and a European reference case.
That means a wafer pulled with hydropower in Yunnan and a wafer pulled with coal-heavy electricity in Inner Mongolia should not be treated as the same carbon product. For buyers, developers and manufacturers doing carbon accounting, regional electricity structure matters more than the country name on the label.
The study also shows that coal has a positive impact contribution in 12 of 16 TOPCon manufacturing indicators. A 5% increase in coal share raises the climate indicator by about 4.8%. Hydropower reduces all 16 indicators, while nuclear power mainly increases the ionizing radiation category but remains stable in most others.
Which Production Levers Should Be Watched Closely?
The sensitivity analysis in Figure 8 separates several process levers and compares them with the 2023 baseline. The result is useful for real factory decision-making because it shows which improvements are meaningful at module level and which are only locally attractive.
| Lever | Assumption | Main Impact | Comment |
|---|---|---|---|
| Efficiency improvement | PERC +12.6%, TOPCon +15.9% according to ITRPV 2034 trend | Broad proportional reduction across indicators | Area-related material consumption per Wp falls as efficiency rises |
| Silver consumption reduced to 5 mg/W | TOPCon silver use reduced by about 78% | Metal resource use reduced by about 41% | Very strong for metal resource impact, but limited influence on other categories |
| Wafer electricity reduced by 26% | Linked with thinner wafers and lower energy demand | Climate impact reduced by more than 9.6% | The strongest process-side lever because wafer stage dominates |
| Silane reduced by 14.4% | Enhanced ICP-PECVD deposition | Less than 0.3% module-level impact reduction | Cell-stage chemicals matter less because the cell stage has lower overall weight |
One point is easy to miss: reducing silane by 14% sounds attractive, but the module-level environmental improvement is less than 0.3%. The reason is simple. The cell stage is not the dominant contributor in the complete module LCA. Saving wafer electricity is much more important than saving small amounts of process gas.
Contact Purchase
Practical Takeaways for TOPCon Line Planning
For manufacturers planning PERC-to-TOPCon upgrades, this LCA sends a clear signal: TOPCon is environmentally stronger in most categories, but silver and wafer electricity must be managed seriously.
The most important production-side priorities are:
- Reduce silver consumption per watt through paste optimization, fine-line printing, busbar design and alternative metallization routes.
- Track wafer and polysilicon electricity sources, not only cell line energy consumption.
- Treat sub-grid power mix as a key carbon-accounting variable, especially in large manufacturing countries.
- Prioritize efficiency improvement because it lowers area-related material use per watt.
- Avoid overestimating the module-level benefit of small cell-process chemical reductions when upstream wafer energy remains dominant.
Ooitech's View
As an equipment supplier working close to module manufacturing lines, we see it this way: TOPCon’s environmental advantage will be decided less by one single cell process step and more by the combined control of efficiency, silver consumption and upstream wafer energy. For a factory upgrade, the practical question is not simply “PERC or TOPCon”, but whether the new line is designed with lower silver use, stable high efficiency and transparent supply-chain carbon data from the beginning. This is where production equipment planning and process discipline become part of the carbon strategy, not just part of capacity expansion.